Create your own FOREX & stocks signal!
Supported platforms: Metatrader 4 (MQL), TradingView (Pine script).

What is Foxzard Indicator Builder?

Foxzard is an online indicator builder for metatrader platform.

Foxzard builder is an online tool that allows you to create your own indicators for the MetaTrader and TradingView platforms.

Combine common indicators into your own unique signal. No programming experience required. Sign up now and create your first signal in seconds.

Foxzard Paws Expert Advisor

Foxzard Paws is Metatrader 4 Expert Advisor (EA) panel.

Foxzard Paws EA is used to quickly open and close orders, modify stop loss and take profit by dragging lines on the chart. It also has a button to quickly take partial profit, move SL to breakeven and more...

Who can use it?

Foxzard is ultra easy indicator builder for anyone to use.

Foxzard is very easy for anyone to use. Start creating your own signal indicators now – absolutely no programming skills necessary.

All you need is some basic knowledge of common forex indicators and technical analysis.

Trailing and partial profit EAs

LandOfCash Partial Profit expert advisor.

LOCTrailing with Partial Close expert advisor will automatically trail stop loss using one of ten trailing algorithms.

You can set a Breakeven Level and Partial Close function can be configured to close a part of the position after specified profit. More info...

Indicator builder features & functions

Features

  • MetaTrader 4 (any version) compatible
  • TradingView pine script compatible
  • Indicator Source Code
  • Signal provider for Foxzard Trader EA
  • Unlimited number of conditions
  • Independent conditions for buy and sell

Conditions

  • Indicator lines cross
  • Indicator line A is higher than indicator line B
  • Indicator line changes direction
  • Indicator reaches a static value

Indicators

  • Moving Average (MA)
  • Stochastic
  • Moving Average Convergence Divergence (MACD)
  • Commodity Channel Index (CCI)
  • Relative Strength Index (RSI)

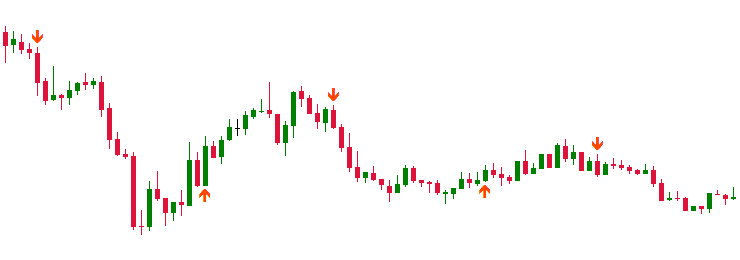
What is a signal indicator?

Signal indicator is a normal MT4 indicator that can be used for manual or automated trading with EA.

A signal indicator is normal MT4 / TradingView custom indicator that draws arrows on the chart when all conditions are met.

It can be used as a helper when trading manually or as a signal provider for Foxzard Trader EA and automated trading.

Is it profitable?

EA and indicator profitability depends on the indicator quality

Foxzard enables you to create and test your own trading ideas and trading logic. Forex is an ever changing medium, so your indicators and signals must adapt to remain profitable.

With Foxzard you can tweak and test your trading rules to keep them profitable.

Foxard Expert Advisors For Metatrader 4 (MT4).

Community created public signal indicators.

cryptomadepub25 6/14/2025 10:53 PM
Common Settings Across All Strategies: Stop Loss: 30% from entry price Risk/Reward: Aim for 1:3+ on ideal setups Trend Confirmation: 15M + 1H + 4H alignment Entry Timeframes: 1M, 5M, 15M Leverage: Adjustable, use risk management Tools: RSI, MACD, EMA, VWAP, BB, Supertrend, OBV, Ichimoku, Fib βœ… Strategy 1: Triple EMA Trend Scalper Indicators: EMA 20, EMA 50, EMA 200 Buy Condition: EMA 20 > EMA 50 > EMA 200 (bullish alignment) RSI < 40 (oversold pullback) Candle closes above EMA 20 Sell Condition: Opposite alignment + RSI > 60 SL: 30% below EMA 200 βœ… Strategy 2: Bollinger Band Bounce + RSI Divergence Indicators: BB (20,2), RSI, MACD Buy Condition: Price touches lower Bollinger Band RSI divergence (price down, RSI up) MACD crossover (bullish) Sell Condition: Reverse SL: 30% under BB lower band βœ… Strategy 3: VWAP Volume Boost Indicators: VWAP, OBV, RSI Buy Condition: Price reclaims VWAP after dip OBV making higher highs RSI crosses 50 upward Sell Condition: VWAP rejection + RSI < 50 SL: 30% below VWAP reclaim candle βœ… Strategy 4: Supertrend + RSI + EMA Indicators: Supertrend (10,3), RSI, EMA 50 Buy Condition: Supertrend = Green RSI > 55 Price above EMA 50 Sell Condition: RSI crosses < 50 and Supertrend flips red SL: 30% below Supertrend line βœ… Strategy 5: MACD Convergence Sniper Indicators: MACD, EMA 200, RSI Buy Condition: MACD histogram turns green Price above EMA 200 RSI > 50 and climbing Sell Condition: MACD histogram turns red SL: 30% below MACD crossover candle βœ… Strategy 6: Ichimoku Cloud Squeeze Indicators: Ichimoku Cloud, EMA 100 Buy Condition: Price breaks above cloud Tenkan > Kijun Lagging span above price Price > EMA 100 Sell Condition: Price below cloud + Kijun crosses Tenkan SL: 30% below Kijun-sen or cloud support βœ… Strategy 7: Fibonacci Golden Zone Bounce Indicators: Fib Retracement (trend drawn), RSI, Volume Buy Condition: Pullback into 61.8%-50% fib zone RSI bounces > 45 Volume spike on bounce candle Sell Condition: RSI overbought + Fib 1.618 extension hit SL: 30% below 61.8% level βœ… Strategy 8: Trendline + OBV Confluence Indicators: OBV, Trendlines (manual or Auto trendline), RSI Buy Condition: Price breaks key descending trendline OBV breakout matches RSI breaks > 50 Sell Condition: Price falls back below trendline SL: 30% below breakout candle βœ… Strategy 9: ADX Power Breakout Indicators: ADX, RSI, EMA 200 Buy Condition: ADX > 25 and rising Price breaks EMA 200 with volume RSI between 55–70 Sell Condition: ADX drops under 20 SL: 30% under breakout candle or EMA 200 βœ… Strategy 10: Multi-Timeframe Momentum Stack Indicators: RSI, MACD, Supertrend, EMA 20/50/200 Buy Condition: 4H, 1H, 15M all in uptrend (EMA stack) RSI > 50 across 3 timeframes MACD green on 1H and 15M Sell Condition: MACD and RSI reverse SL: 30% below recent 15M swing low 🧪 Pro Tips for Backtesting: Use TradingView’s strategy tester or export price data for Python/backtest tools. Look for confluence: no signal is taken unless 3+ indicators agree. Use ATR filters to avoid ranging markets. Filter entries during major news events unless high-volatility scalping.
Anonymous 6/14/2025 10:48 PM
Common Settings Across All Strategies: Stop Loss: 30% from entry price Risk/Reward: Aim for 1:3+ on ideal setups Trend Confirmation: 15M + 1H + 4H alignment Entry Timeframes: 1M, 5M, 15M Leverage: Adjustable, use risk management Tools: RSI, MACD, EMA, VWAP, BB, Supertrend, OBV, Ichimoku, Fib βœ… Strategy 1: Triple EMA Trend Scalper Indicators: EMA 20, EMA 50, EMA 200 Buy Condition: EMA 20 > EMA 50 > EMA 200 (bullish alignment) RSI < 40 (oversold pullback) Candle closes above EMA 20 Sell Condition: Opposite alignment + RSI > 60 SL: 30% below EMA 200 βœ… Strategy 2: Bollinger Band Bounce + RSI Divergence Indicators: BB (20,2), RSI, MACD Buy Condition: Price touches lower Bollinger Band RSI divergence (price down, RSI up) MACD crossover (bullish) Sell Condition: Reverse SL: 30% under BB lower band βœ… Strategy 3: VWAP Volume Boost Indicators: VWAP, OBV, RSI Buy Condition: Price reclaims VWAP after dip OBV making higher highs RSI crosses 50 upward Sell Condition: VWAP rejection + RSI < 50 SL: 30% below VWAP reclaim candle βœ… Strategy 4: Supertrend + RSI + EMA Indicators: Supertrend (10,3), RSI, EMA 50 Buy Condition: Supertrend = Green RSI > 55 Price above EMA 50 Sell Condition: RSI crosses < 50 and Supertrend flips red SL: 30% below Supertrend line βœ… Strategy 5: MACD Convergence Sniper Indicators: MACD, EMA 200, RSI Buy Condition: MACD histogram turns green Price above EMA 200 RSI > 50 and climbing Sell Condition: MACD histogram turns red SL: 30% below MACD crossover candle βœ… Strategy 6: Ichimoku Cloud Squeeze Indicators: Ichimoku Cloud, EMA 100 Buy Condition: Price breaks above cloud Tenkan > Kijun Lagging span above price Price > EMA 100 Sell Condition: Price below cloud + Kijun crosses Tenkan SL: 30% below Kijun-sen or cloud support βœ… Strategy 7: Fibonacci Golden Zone Bounce Indicators: Fib Retracement (trend drawn), RSI, Volume Buy Condition: Pullback into 61.8%-50% fib zone RSI bounces > 45 Volume spike on bounce candle Sell Condition: RSI overbought + Fib 1.618 extension hit SL: 30% below 61.8% level βœ… Strategy 8: Trendline + OBV Confluence Indicators: OBV, Trendlines (manual or Auto trendline), RSI Buy Condition: Price breaks key descending trendline OBV breakout matches RSI breaks > 50 Sell Condition: Price falls back below trendline SL: 30% below breakout candle βœ… Strategy 9: ADX Power Breakout Indicators: ADX, RSI, EMA 200 Buy Condition: ADX > 25 and rising Price breaks EMA 200 with volume RSI between 55–70 Sell Condition: ADX drops under 20 SL: 30% under breakout candle or EMA 200 βœ… Strategy 10: Multi-Timeframe Momentum Stack Indicators: RSI, MACD, Supertrend, EMA 20/50/200 Buy Condition: 4H, 1H, 15M all in uptrend (EMA stack) RSI > 50 across 3 timeframes MACD green on 1H and 15M Sell Condition: MACD and RSI reverse SL: 30% below recent 15M swing low 🧪 Pro Tips for Backtesting: Use TradingView’s strategy tester or export price data for Python/backtest tools. Look for confluence: no signal is taken unless 3+ indicators agree. Use ATR filters to avoid ranging markets. Filter entries during major news events unless high-volatility scalping.

FOT

linkunolinkun25 6/12/2025 4:10 AM
EMA60 STOCH603015
MAWUKO 4/12/2025 11:38 AM
Both 100sma and 200 sma crossed Wait for pull back Stochastic 40.8.6 overbought or oversold
MAWUKO 4/12/2025 10:20 AM
Arrow indicator for a buy and sell. This should be 2 pips away from candle. The 100 sma is shift 10. I
MAWUKO 4/12/2025 10:13 AM
mt4 custom indicator On daily chart stochastic setting 110.50.50 should be below 30 and cross up for buy and from 70 cross down for a sell. Stochastic is linear weighted and close. At the same time reversal candle crossed 100 sma shift 10 and closed . The arrow will appear 2 pips away from the candle at same point. It should have an alert with sound and mobile notification. Arrow color and size should be adjustable.